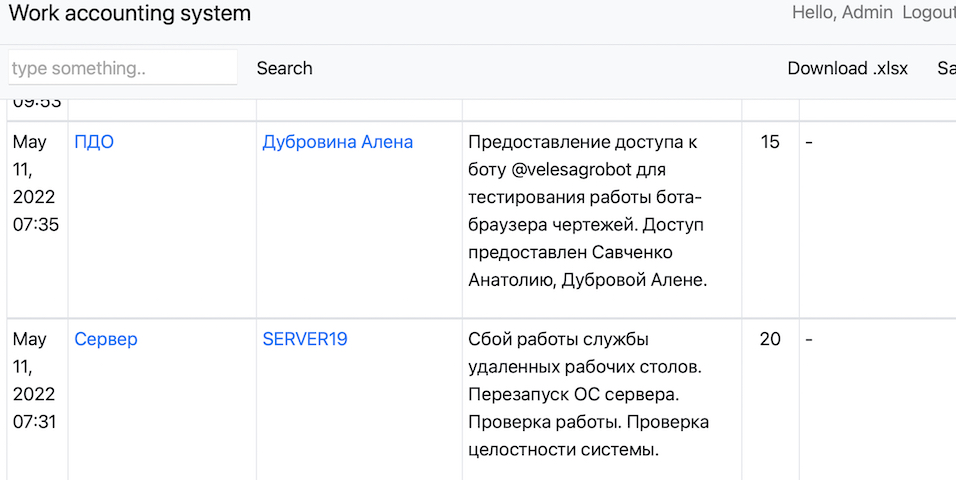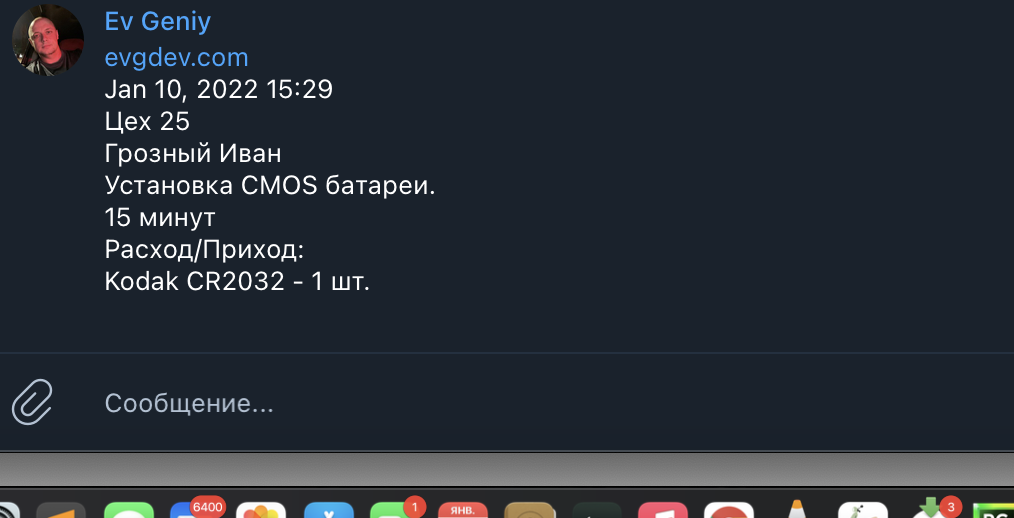
I wanted to see a graphical representation of the time for each day of my work. This will help analyze my load. I have a django model that stores time records for each event. The task is to sum up the time for each day and display it in a graph for the last 7 days.
First, let’s create a graph creation function in file utils.py:
import matplotlib.pyplot as plt
import base64
from io import BytesIO

def get_graph():
    buffer = BytesIO()
    plt.savefig(buffer, format='png')
    buffer.seek(0)
    image_png = buffer.getvalue()
    graph = base64.b64encode(image_png)
    graph = graph.decode('utf-8')
    buffer.close()
    return graph

def get_plot(x,y):
    plt.switch_backend('AGG')
    plt.figure(figsize=(10,5))
    plt.title('Active working time')
    plt.bar(x,y)
    #plt.xticks(rotation=45)
    plt.xlabel('Days before')
    plt.ylabel('Minutes')
    plt.tight_layout()
    graph = get_graph()
    return graph
For SVG:
def get_graph_svg():
    buffer = BytesIO()
    plt.savefig(buffer, format='svg')
    buffer.seek(0)
    image_svg = buffer.getvalue()
    graph = base64.b64encode(image_svg)
    graph = graph.decode('utf-8')
    buffer.close()
    return graph

def get_plot_svg(x,y):
    plt.switch_backend('SVG')
    plt.figure(figsize=(15,5))
    plt.title('Active working time')
    plt.bar(x,y)
    #plt.xticks(rotation=45)
    plt.xlabel('Days before')
    plt.ylabel('Minutes')
    plt.tight_layout()
    graph = get_graph_svg()
    return graph
Then we calculate the data array for the graph from our model in views.py:
def index(request):
    """Main page"""
    x = []
    y = []
    i = 0
    while i<=7:
        daywork = datetime.now().day -i
        dayview = Addinfo.objects.filter(date_added__day=daywork).values_list('work_minutes', flat=True)
        y.append(sum([int(minn) for minn in dayview]))
        x.append(i)
        i += 1

    chart = get_plot(x, y)
    return render(request, 'reportss/index.html', {'chart': chart}
And we will describe the insertion of the chart in the template:
{% if user.is_authenticated %}
    {% if chart %}
        <img src="data:image/png;base64, {{chart|safe}}" class="img-fluid">
    {% endif %}
{% endif %}
For SVG:
<div class="w-100 p-3"><center><img src="data:image/svg+xml;base64,{{chart|safe}}" class="img-fluid"></center></div>
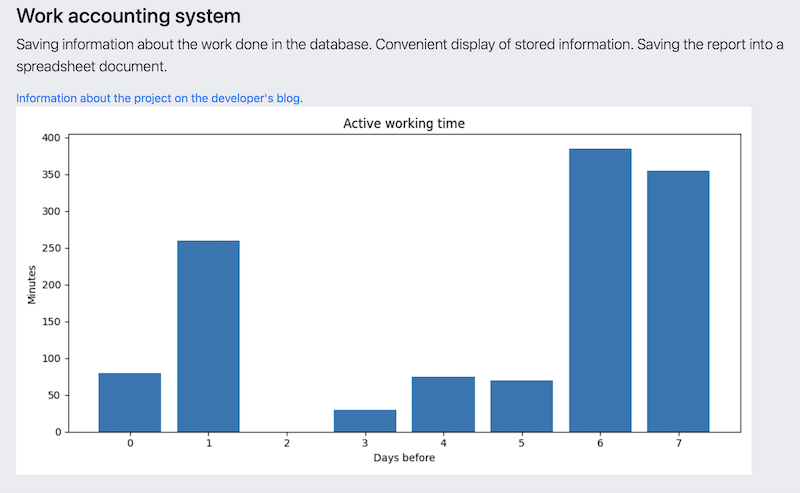
RESULT:

Don’t forget install matploplib dependencies (How To Add Matplotlib To Django).